Customer segmentation dashboard
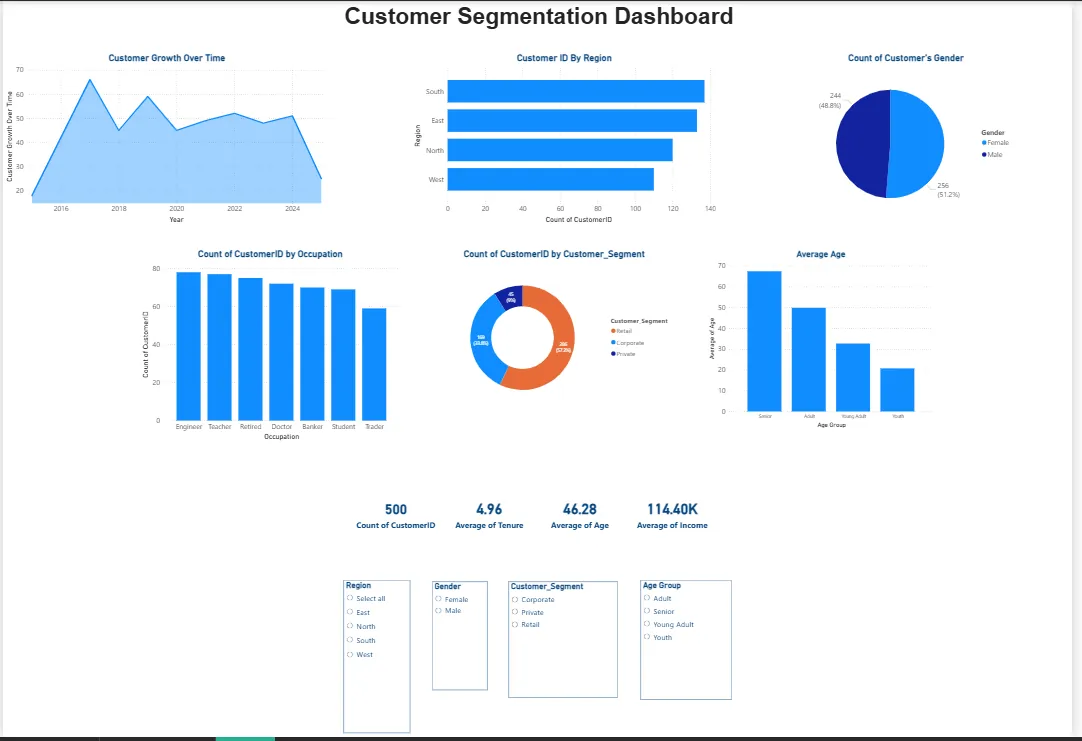
A one-page Power BI dashboard profiling 500 customers by region, gender, occupation, segment and age group.
The challenge
Management wanted to understand customer growth and how the customer base is spread across regions and demographic groups, to target marketing better.
My approach
I built a single interactive Power BI page with headline figures, a growth trend and breakdowns, filterable by region, gender, segment and age group.
Process
- Summarised customer count, average tenure, average age and average income.
- Charted new customers per year from 2016 to 2024.
- Broke customers down by region, gender, occupation, segment and age group.
What I found
- Customer acquisition peaked between 2016 and 2018 at more than 60 new customers a year, then fluctuated and declined after 2024.
- The South region has the most customers and the West the fewest.
- The gender split is close to even: 51.2% female and 48.8% male.
- Engineering is the largest occupation group (78 customers) and Trading the smallest (59).
- The customer base leans older: seniors are the largest age group and youth the smallest.
Recommendations
- Steady acquisition with sustained, data-driven marketing.
- Targeted campaigns in under-represented regions.
- Products and channels aimed at younger customers.
- Loyalty rewards for customers approaching five years' tenure.